Upcoming: Opposing Data Stories
Saturday, Nov 21 · 10:00 AM to 12:00 PM CST
The Coffee Shop NE
2852 Johnson St NE · Minneapolis, MN
Same data. Opposite stories.
Join tcplot for a morning of honest lies: we'll chart one dataset two ways, once as a crisis and once as nothing to see, without changing a single number.
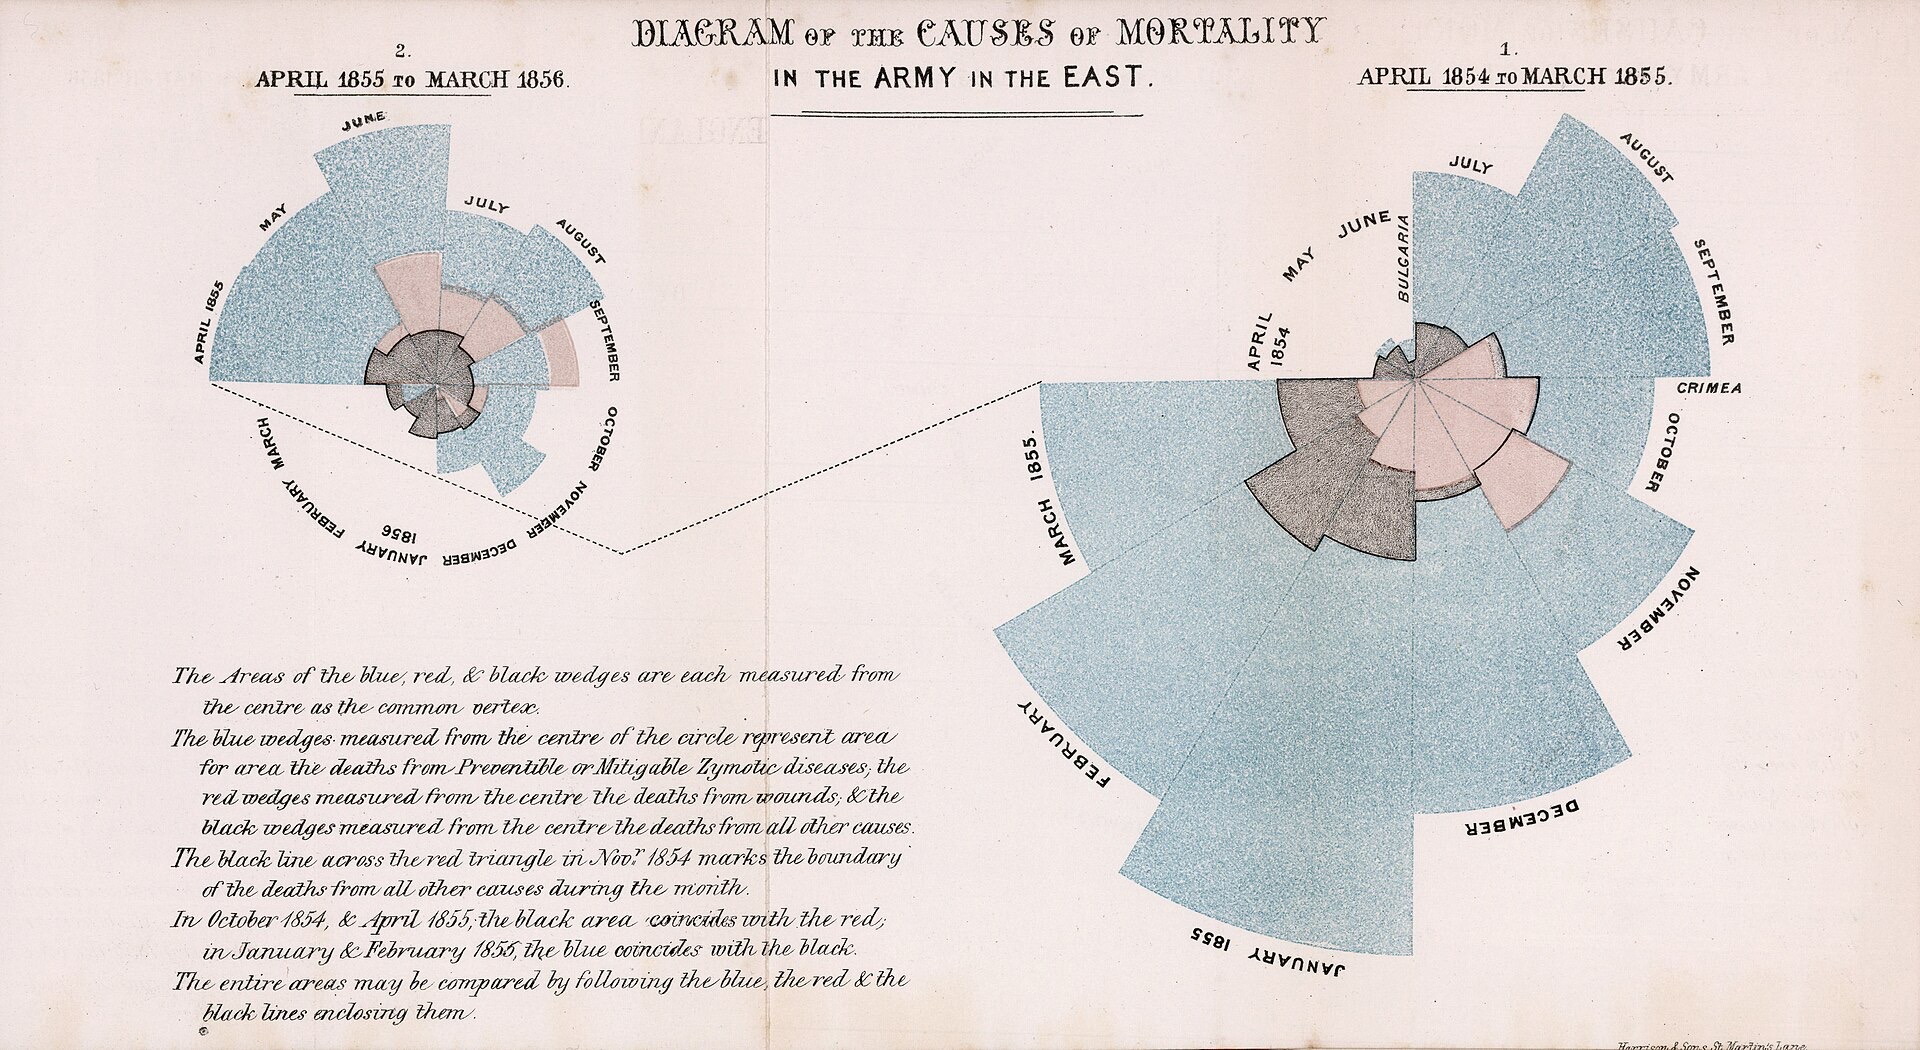
Florence Nightingale, Diagram of the Causes of Mortality in the Army in the East (1858). Blue wedges are deaths from preventable disease. She set the year before sanitary reform (right) beside the year after (left) and sent it to the people who set policy: a chart built to win an argument.
Act one: bring a chart that spins
Your ticket in is one chart and two minutes on the story it tells: a chart that misled you, a chart that changed your mind, or a chart where you can't tell which one it did.
Act two: spin it both ways
Solo or in pairs, take one dataset from our local starter set and two briefs: make it look alarming, then make it look like nothing. One rule: the data stays the same. Every row, no fake numbers, no cherry-picking. Only design choices are allowed:
- axis ranges, baselines, and aspect ratio
- binning, chart type, and scale
- titles, annotations, and emphasis
- the illusions your eye can't refuse
Then the reveal: each person or pair puts their two charts up side by side, and the room guesses which choice is doing the work. We'll name every trick, and close with what an honest version looks like.
Datawrapper, a spreadsheet, or pen and paper all work, and coders are welcome to bring D3, Observable Plot, matplotlib, or ggplot2. Bring a chart with a story and, if you want to build digitally, a laptop.
RSVP on Meetup.
Hope to see you there!