Past Event: Data Collection & Visualization in the Park
Saturday, Aug 29 · 10:00 AM to 12:00 PM CDT
The Coffee Shop NE
2852 Johnson St NE · Minneapolis, MN
The best dataset is the one you gather yourself.
Join tcplot for a morning that starts with coffee and ends with a chart. We'll meet at The Coffee Shop NE, walk over to Audubon Park to collect data by hand, then come back and turn what we gathered into a visualization.
Data collection is usually invisible — by the time most of us see a dataset, someone else has already decided what counts. This is a chance to make those decisions yourself: what to measure, how to tally it, and what gets left out. The constraints of a clipboard and forty minutes turn out to be the whole lesson.
Physics learned this lesson first. There is no way to observe a system without physically interacting with it — the photon that lets you see the electron also knocks it off course — and relativity showed that even simple quantities depend on where the observer stands. Physicists' answer wasn't to give up on measurement; it was to treat the observer as part of the apparatus: characterize your detector, state your reference frame, and publish both alongside the data. A person with a clipboard is a detector too — with a hearing range, an attention span, and a bias toward motion — and this morning is about calibrating that instrument, not pretending it isn't there.
That said — how seriously you take any of this is entirely up to you. The depth is there if you want it, but if you're here for a walk in the park with new people, do that. Count whatever makes you smile. Have as much fun with it as you want.
How the morning will flow
- ▸ 10:00 — Coffee & protocol. Quick intros at The Coffee Shop NE, then each of us picks something to count and writes a short collection protocol before we ever see the park: what counts as one, where you'll observe from, and for how long. Writing it down first is the difference between deciding the rules and discovering, mid-count, that you're bending them.
- ▸ 10:30 — Collect. Walk to Audubon Park and spend about forty minutes running your protocol. Keep a second column for judgment calls — every "wait, does this count?" moment is data about your data, and we'll want it later.
- ▸ 11:15 — Visualize. Head back and turn your raw tallies into something readable — on paper, in code, or in beads and thread.
- ▸ 11:45 — Share & compare. The interesting part isn't whose chart is prettiest. It's when two people counted "the same thing" and got different numbers — and we can trace the disagreement back to a line in their protocols.
Data is made, not found
Every number in every dataset began as a judgment call. Someone decided what to look at, what counts as one instance, when to start looking, and when to stop. By the time data reaches a spreadsheet those decisions have vanished into the cells — the numbers look like they fell out of the world on their own. The media scholar Lisa Gitelman titled a whole book on this "Raw Data" Is an Oxymoron: there is no such thing as data before human choices, only data whose choices we've stopped noticing.
That's not a reason to distrust data — it's a reason to understand it. A dataset is a made thing, like a photograph: the world is really in it, but so is the person holding the camera, the direction they pointed it, and everything outside the frame. Spending one morning as the person holding the clipboard makes those fingerprints visible in a way no amount of reading about bias can.
Selection effects: your method picks your data
Before you tally a single bird, your procedure has already decided which birds you're capable of tallying. This is the selection effect, and the park is full of them:
- ▸ Where you walk is a filter. Count birds from the path and you've sampled the path's park, not the park. Loud, bold, tree-top species get oversampled; the quiet brown bird under the shrub exists just as much as the crow, but your dataset will say otherwise. Ecologists call this detectability bias — the gap between what's there and what your method can see.
- ▸ When you look is a filter. Saturday at 10 AM is a specific park: the dog-walkers-and-strollers park. The 6 AM runners and the evening pickup games are invisible to us — not absent from the park, absent from the sample. Any claim we make is really a claim about "Audubon Park, late Saturday morning, late August."
- ▸ Ease of measurement is a filter. We gravitate toward what's countable — the streetlight effect, from the old joke about searching for keys under the lamp because the light is better there. Dandelions get counted; soil chemistry doesn't. Datasets are maps of what was convenient to measure at least as much as maps of what mattered.
- ▸ You are a filter. Squirrels flee, dogs approach, people change their pace when they notice someone with a clipboard watching. The act of observing edits the thing observed — a problem field scientists manage but never fully eliminate.
Put together: a dataset isn't a picture of the park. It's the intersection of the park and a procedure. Change the procedure and you get a different dataset from the same grass.
How scientists make counting fair
Since selection effects can't be wished away, field scientists answer them with standardization — a toolkit refined over a century of ecology and survey research, all of which fits on a clipboard. We'll practice the real thing:
- ▸ Operational definitions. Decide in writing, in advance, what counts as one. Is a dandelion gone to seed still a dandelion? Is a puppy a dog? Is someone jogging to catch a frisbee "running"? Any answer is defensible; what's not defensible is deciding case-by-case as you go, because your mood becomes part of the measurement.
- ▸ Randomized placement. The loop-of-string survey is a quadrat, the workhorse of plant ecology — and the rule is you toss it over your shoulder rather than lay it where the flowers are pretty. Letting chance choose the spot is how you stop your eye from choosing it for you.
- ▸ Transects and point counts. Two more classics you can run in a city park: walk one straight, predetermined line and count only within a meter of it (a transect), or stand at a fixed spot for a fixed number of minutes and record everything you can detect (a point count — the method behind national breeding-bird surveys). Both replace "wander wherever looks interesting" with a rule set before you saw anything.
- ▸ Fixed effort. Counts are only comparable when the effort behind them is equal — same minutes, same area, same pace. Ten dogs in forty minutes and ten dogs in ten minutes are different facts wearing the same number.
- ▸ Pilot, then freeze. Dry-run your protocol for five minutes, patch the holes it reveals, then stop editing it. Changing the rules mid-count quietly turns one dataset into two. (Writing the protocol before collecting is the same discipline that leads scientists to preregister studies.)
- ▸ Check your agreement. If two of us run the same protocol side by side and compare tallies, the gap between our numbers measures the protocol, not the counters. This is inter-rater reliability, and it's the closest thing data collection has to a unit test.
- ▸ Record the circumstances. Time, weather, where you stood, what interrupted you. A count without its conditions can't be compared, repeated, or trusted later — metadata is what turns a tally into evidence.
None of this makes data objective. It does something more honest: it makes the subjectivity explicit, documented, and repeatable, so the next person can see exactly which somewhere your numbers came from — and stand in the same spot to check them. That, not a view from nowhere, is what rigor actually is.
Things you could count
Pick one and go deep, or track a few at once. Whatever you choose, pair it with one of the methods above — a quadrat, a transect, a point count, a fixed time window. A handful of ideas:
- ▸ Lay a loop of string on the ground and survey everything inside the circle — bugs, plants, blades of grass, clover, whatever you find
- ▸ Birds, squirrels, and dogs — by count, by type, by minute
- ▸ How people pass through: walking, running, biking, rolling, with strollers
- ▸ Trees by species, or the colors of the leaves
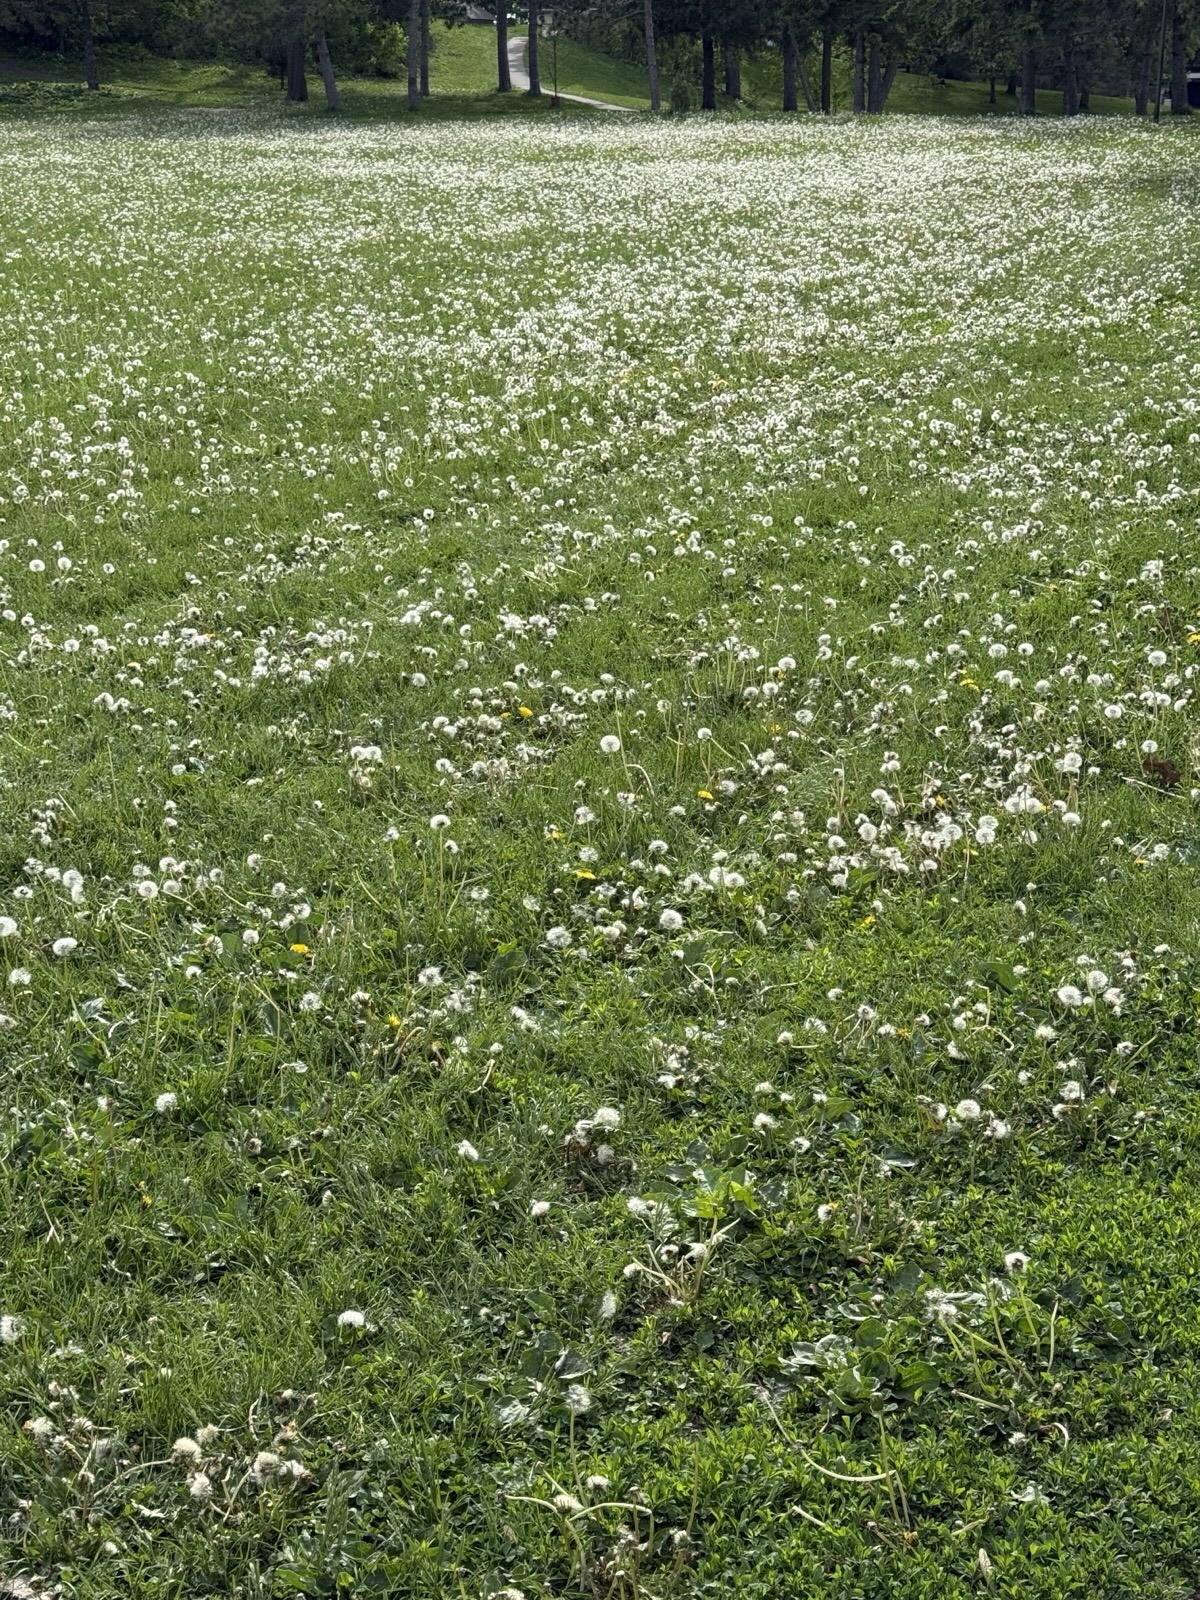
- ▸ Dandelions in the grass — where they cluster and where they don't
- ▸ Sounds — and how often each one interrupts the quiet
- ▸ Benches: how long anyone stays, and what brings them there
Case study: photograph → identify → visualize
Want a complete pipeline you can run with just your phone? Here's one worked path through the morning:
- ▸ Collect: take photos. Pick a rule first — every plant inside your quadrat, every organism within a meter of a transect line, or one photo at fixed intervals along a set route. Your phone stamps each shot with time and location, so the metadata comes free.
- ▸ Identify with iNaturalist. Upload your photos to the free iNaturalist app and its computer-vision model will suggest a species for each one; a community of naturalists then confirms or corrects the IDs. Suddenly your camera roll is a table: species, genus, family, time, place.
- ▸ Visualize the photos themselves. Back at the coffee shop, the images are your dataset: a bar chart of species counts, a treemap by taxonomic family, the photos laid out in a grid sorted by color or kinship, or a hand-drawn map with each observation pinned where you stood.
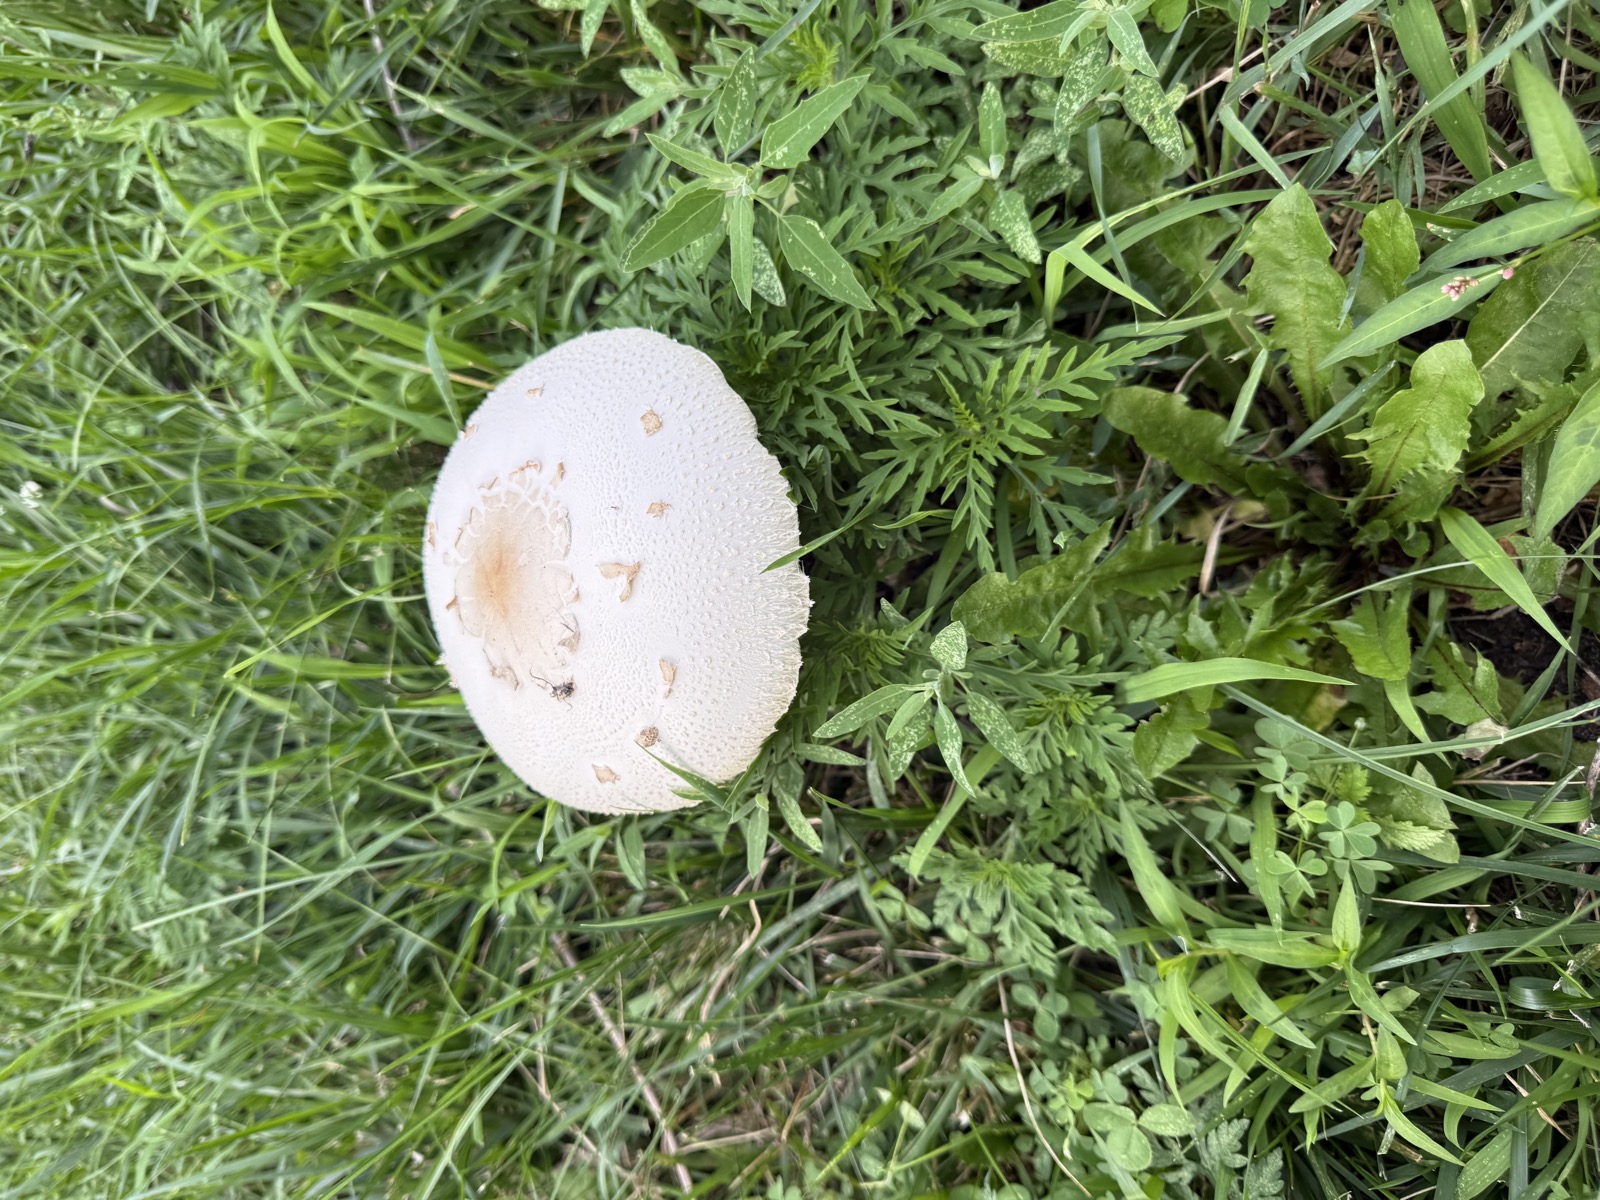
Bonus lesson included: iNaturalist's scientists wrestle with exactly the selection effects described above. People photograph what catches their eye, so the platform's data is rich in showy flowers and charismatic mushrooms and thin on grasses and gnats — which is why your boring-but-fair quadrat rule matters more than your camera.
What to bring
Something to record with — a notebook or your phone — and shoes for a short walk. A laptop is welcome for the visualizing part but not required; we'll have paper and making supplies on hand. Dress for the weather.
Rain plan: light rain, we'll go anyway. Heavy rain, we'll collect our data right from The Coffee Shop NE.
Who this is for
Anyone curious about where data comes from — practitioners and first-timers alike. No tools or experience required, just a willingness to notice things.
Hope to see you there!